Health care, education and public administration accounted for most of Australia’s employment growth from 2023 to 2025, and much of that work is publicly funded. When economists talk about this part of the workforce, they usually use the ABS term “non-market sector”. It covers three industries: health care and social assistance, education and training, and public administration and safety. The ABS describes these as industries where output generally isn’t sold at economically significant prices. In plain terms, much of the cost is paid for or subsidised by government rather than by the customer directly.

At a glance
For several years, health care, education and public administration accounted for most of Australia’s employment growth, which supported household spending. More recently, market sector industries have accounted for most new jobs. Find out what that shift means for competition for staff, inflation and your customers’ income, and which businesses it affects most.
Knowing what drives your customers’ income makes every other marketing decision easier, so it’s a regular starting point in our consulting work.
What we mean by the non-market sector
That’s not the same as the public sector. Many of these jobs are with private businesses and not-for-profit organisations, such as private hospitals, medical and dental practices, childcare centres, aged care providers and independent schools. But funding from government plays a large role across all of them.
The long-run picture
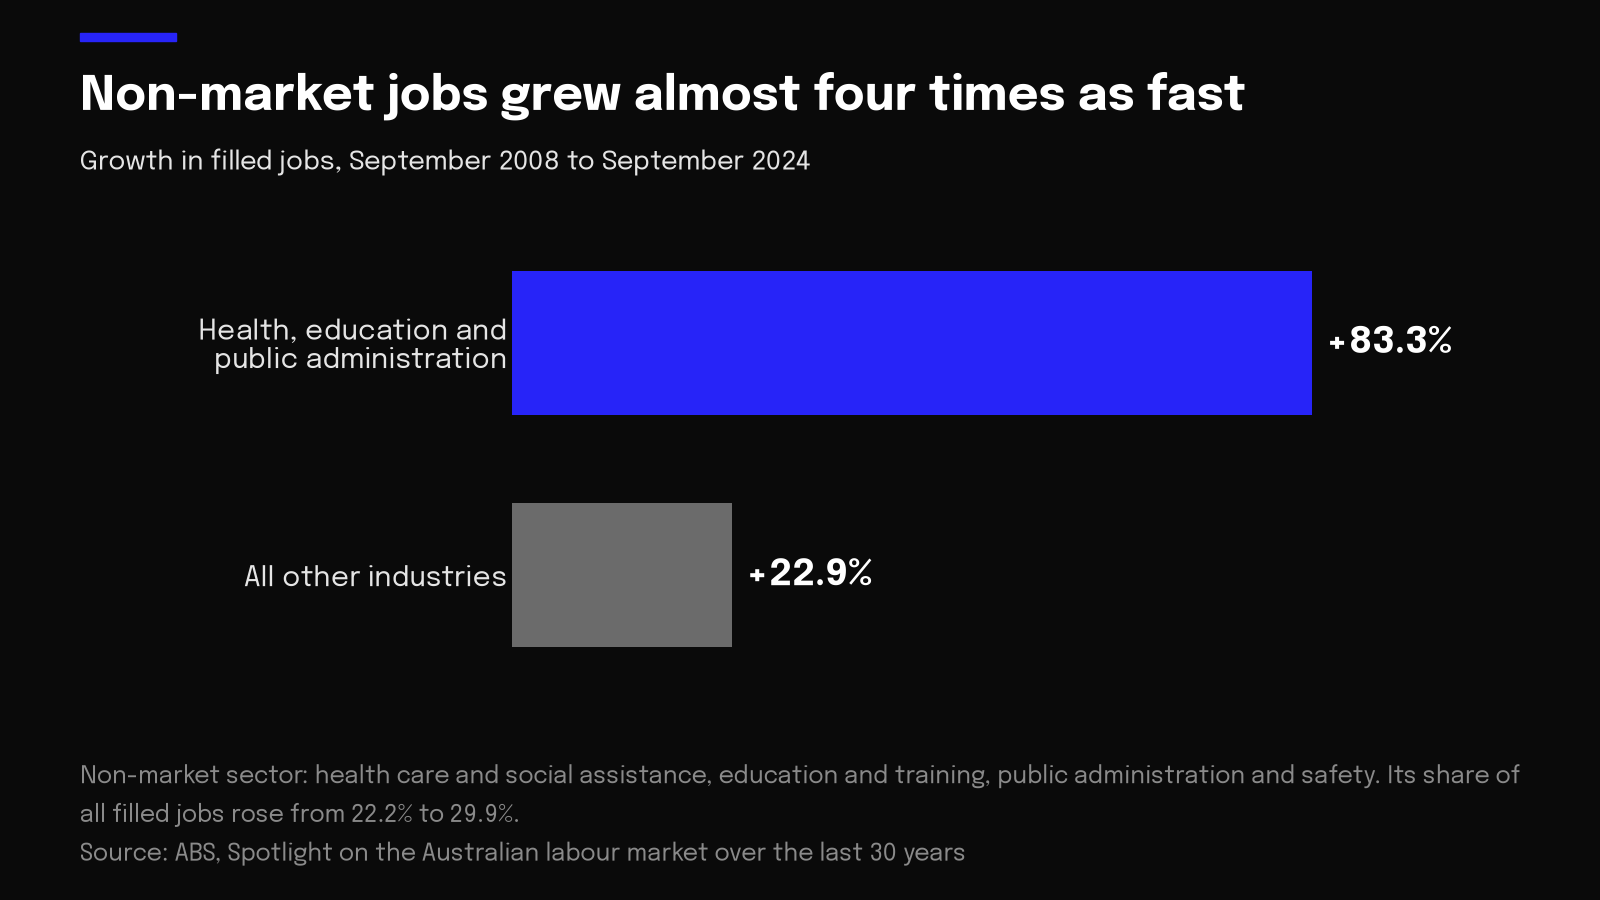
This part of the workforce has been growing faster than the rest of the economy for a long time. The ABS found that between September 2008 and September 2024, filled jobs in the non-market sector grew 83.3%, compared with 22.9% in the market sector. Its share of all jobs rose from 22.2% in 2008 to 29.9% in 2024, with health care and social assistance the main driver.
Health care and social assistance is now Australia’s largest industry by jobs. The ABS Labour Account shows more than 2.6 million jobs in the industry in the June quarter of 2026.
Several forces sit behind this, including a growing and ageing population and rising demand for services such as health, aged care, childcare and education, much of it funded by government.
2023 to 2025: where employment growth came from
From 2023 to 2025, employment growth was concentrated in these industries, and the wages they paid supported household spending.
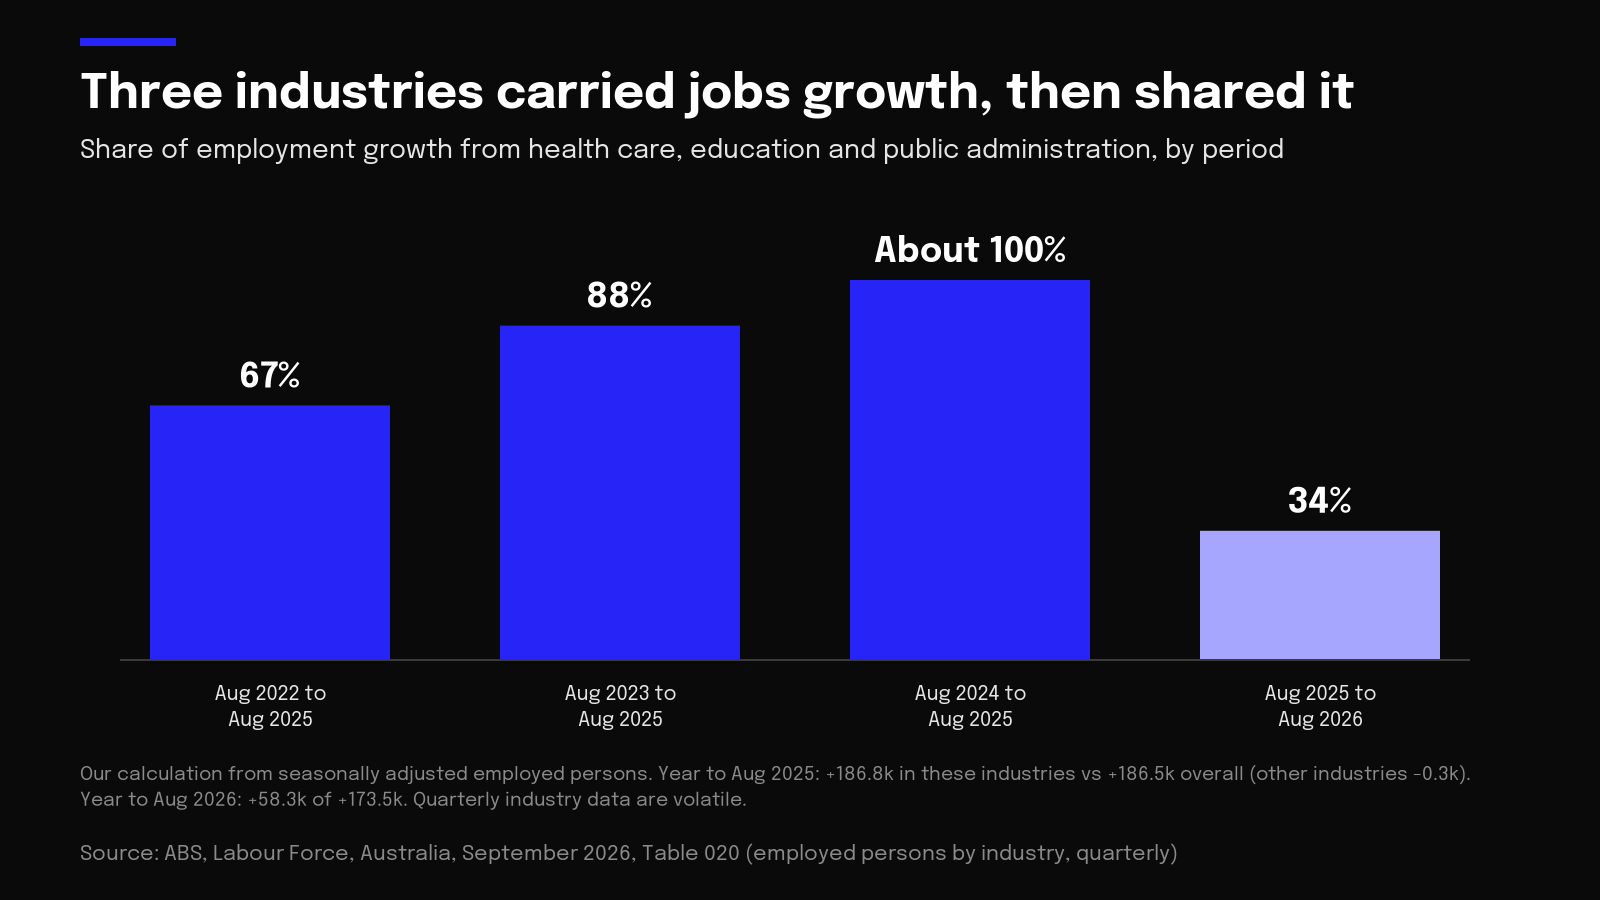
Based on our analysis of ABS Labour Force industry data (Labour Force, Australia, Table 020, employed persons by industry, quarterly, seasonally adjusted), health care, education and public administration together accounted for:
- about 88% of employment growth over the two years from August 2023 to August 2025
- effectively all of the employment growth in the year to August 2025, when other industries combined were broadly flat
The Reserve Bank reached a similar conclusion. In February 2025, it found that over half of all employment growth in the year to September 2024 came from health care alone.
Why that mattered for spending
While interest rates were high and hiring in many private industries slowed, employment in these industries kept wages flowing into households. Every nurse, teacher, carer and public servant hired is also a customer: someone paying rent or a mortgage, buying groceries, eating out and booking services. Steady employment in these industries helped households keep spending when other parts of the economy were slowing.
The past year: growth shifts to other industries
The picture over the most recent year is different. In the year to August 2026, the same three industries accounted for only about a third of employment growth (seasonally adjusted), by our calculation from the same ABS table.
Health care was still adding jobs, up about 71,000, and education added about 31,000. But public administration and safety employment fell by about 43,000. Meanwhile, private industries picked up the pace, led by construction (about 55,000), administrative and support services (about 32,000) and transport, postal and warehousing (about 28,000).
| Industry | Employed, August 2026 | Change over the year |
|---|---|---|
| Health care and social assistance | 2,427,000 | +70,600 |
| Construction | 1,403,700 | +54,500 |
| Administrative and support services | 457,500 | +32,300 |
| Education and training | 1,329,600 | +30,900 |
| Transport, postal and warehousing | 766,900 | +28,400 |
| Financial and insurance services | 567,300 | +22,700 |
| Manufacturing | 878,400 | +15,900 |
| Mining | 304,200 | +8,700 |
| Wholesale trade | 328,800 | +7,600 |
| Accommodation and food services | 961,600 | +4,100 |
| Arts and recreation services | 268,600 | +2,100 |
| Electricity, gas, water and waste services | 214,300 | +1,900 |
| Rental, hiring and real estate services | 222,300 | +600 |
| Information media and telecommunications | 187,500 | -900 |
| Other services | 568,000 | -3,600 |
| Agriculture, forestry and fishing | 283,000 | -11,500 |
| Retail trade | 1,313,200 | -14,400 |
| Professional, scientific and technical services | 1,355,900 | -33,200 |
| Public administration and safety | 954,800 | -43,200 |
| All industries | 14,792,500 | +173,500 |
Not every private industry grew, though. Professional, scientific and technical services shed about 33,000 jobs over the year and retail about 14,000, so the growth was concentrated in construction, administrative and support services, transport, finance and manufacturing.
Quarterly industry figures move around a lot, and jobs growth across the whole economy has softened in recent months, so it’s too early to call this a permanent shift. But over the year as a whole, industries outside health, education and public administration did most of the hiring.
The ABS Labour Account tells a similar story. In the June quarter of 2026, the number of public sector jobs was unchanged, while private sector jobs grew 0.8%.
The RBA had expected this. In February 2026, it said growth in non-market sector employment “is expected to be below the very strong rates of the past few years”.
So the data shows employment growth from 2023 to 2025 was concentrated in largely publicly funded industries, which supported household spending. Over the past year, the pattern has changed: market sector industries have accounted for most of the growth. And the jobs market as a whole has softened, with the ABS reporting 39,300 fewer people employed in September and unemployment at 4.7%.
The lasting effects
Even as the pace slows, the growth of these industries has left a mark on the economy, and the effects work through step by step.
Competition for workers
The RBA found that strong hiring in health care drew workers from other industries, including administration, hospitality, arts and recreation, and education, and that this “has likely contributed to tight labour market conditions in other industries”. When businesses compete for the same staff, wages rise, and those costs often flow into prices.
Productivity
The Productivity Commission’s September 2026 update found market sector labour productivity has grown 7.5% since June 2014, while non-market sector productivity has fallen 2.5%, and is now below its March 2007 level. Over the year to June 2026, labour productivity across the whole economy fell 0.2%.
It’s worth adding a caution. Output in health, education and public services is hard to measure, because much of it isn’t sold at a market price. Better care or better teaching may not show up fully in the statistics. Even so, the gap matters, because when an economy produces less per hour worked, it’s harder to lift wages without lifting prices.
Sticky inflation and higher rates
Put these together and you get part of the explanation for why inflation has been slow to fall, and why the RBA has raised rates four times this year. Strong demand for workers, rising wages and flat productivity make it harder for price growth to settle.
Who this affects
Customers working in these industries
Around three in ten working Australians are employed in health, education and public administration. Many have relatively secure jobs and incomes. For businesses whose customers include nurses, teachers, allied health workers and public servants, that steady income is a real source of demand, even as private sector conditions change.
Businesses tied to private sector growth
Industries like construction, transport and business services are now the ones adding the most jobs. Businesses that serve these workers and employers may see stronger demand than those whose customers mainly work in the non-market sector.
Our piece on which customers are still spending after the 2026 rate rises covers the other side of household budgets, and our look at where the money goes when households cut back shows where spending is moving. If your customer mix is shifting, our guide to measuring marketing by profit shows how to work out which customers are worth winning.
What to do now
- Look at who your customers are and where they work. If many are in health, education or the public sector, keep speaking to them with messages that suit their schedules, such as shift-friendly booking times and after-hours availability.
- If your customers are increasingly from construction, trades, transport or business services, test offers and messages aimed at them, such as early starts, weekend bookings or business accounts.
- Don’t rely on one type of customer. A mix of customers from different industries spreads your risk as the economy shifts.
- Keep your pricing and offers under review as interest rates and inflation move, rather than locking in assumptions for the year ahead.
Knowing which customers drive your demand should shape your marketing strategy for the year ahead.
For help understanding which customers are driving demand for your business, contact us or email hello@thedigitalmarketingconsultants.com.au.