
Many owners between $3M and $20M reach a point where revenue keeps climbing but profit barely moves. The marketing reports look healthy, ROAS is steady or even rising, and the team is flat out. The cause is rarely bad marketing. More often, marketing is being scored on numbers that can improve while the business earns less.
At a glance
When revenue climbs but profit barely moves, the marketing numbers are often the problem. This article shows why ROAS can mislead, how to judge sales on contribution margin and how to set a break-even acquisition cost. It’s written for owners of growing businesses who want marketing accountable to profit.
This is where marketing and business strategy meet, and it’s usually the first thing worth checking in any consulting conversation. The fix is not a new channel. It’s a small set of numbers that show what each sale and each customer is actually worth, so marketing can be pointed at growth that pays.
Why ROAS Can Rise While Profit Falls
Return on ad spend divides tracked revenue by ad cost. It says nothing about margin, and it doesn’t separate customers you won from customers who would have bought anyway. That gap explains most cases where ROAS goes up while profit goes down.
Returning customers
The first cause is returning customers. When a loyal customer clicks an ad, or sees a retargeting ad before reordering, the platform counts the sale. Those orders are cheap to win and they flatter the numbers. A useful habit is to split every marketing report into new and returning orders. Shopify’s new vs returning customers report does this in a few clicks, and most CRM and practice systems can do the same for service businesses and clinics.
How platforms count sales
The second is where the numbers come from. Ad platforms report conversions using their own rules, and Meta explains that its attribution system credits ads for conversions within set windows after someone clicks or views them. Those figures are useful for optimising campaigns, but your store, CRM or accounting data is the record of what actually happened. When the two disagree, use your own data for business decisions.
Product mix
The third is product mix. If the ads that scale best happen to sell your lowest-margin lines, revenue and ROAS rise together while gross profit stalls.
What the Numbers Can Look Like for an Online Store
Consider an online store that reaches about $1.06M in revenue from roughly 17,000 orders, with around $500K spent on ads and about $148K left as profit. That works out to around $29 of advertising behind every order, on an average order of about $62, and a profit margin of roughly 14 percent.
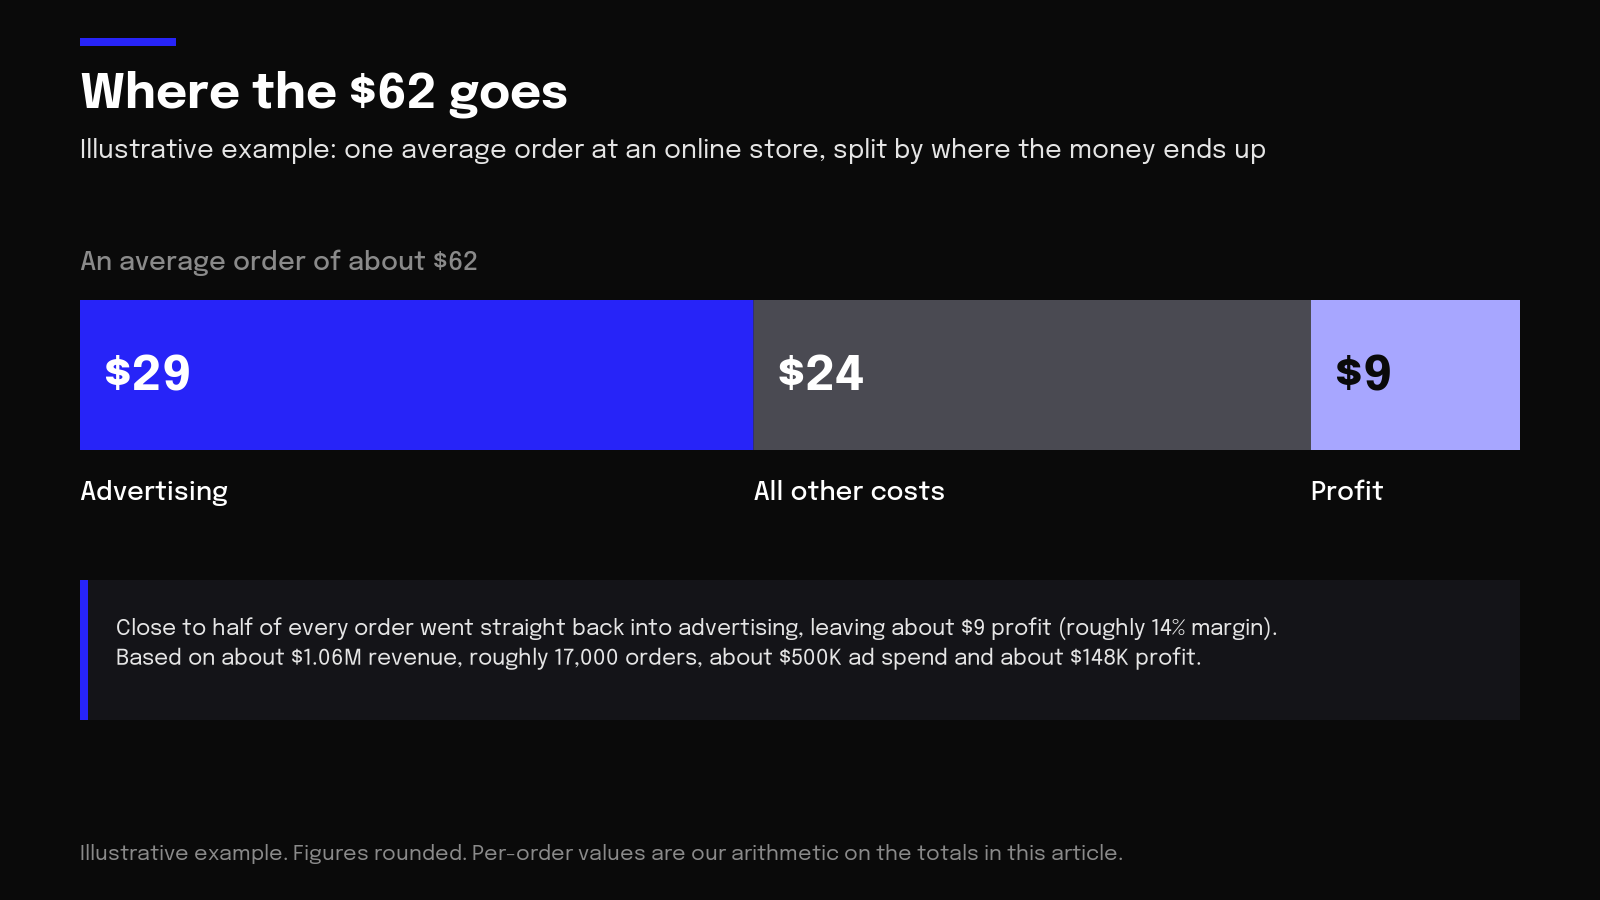
Put another way, close to half of every sale went straight back into acquisition, across new and repeat customers alike. There was very little room for advertising costs to rise, and ad costs tend to rise every year. Nothing in the revenue figure would show that. Ad spend per order and margin per order do, which is why it pays to ask how much of each order is left after the cost of winning it before asking how to grow revenue.
Which Marketing Numbers to Trust
| Metric | What it tells you | Where it can mislead |
|---|---|---|
| Blended ROAS | Revenue per advertising dollar | Counts repeat buyers as ad wins |
| New customer acquisition cost | Cost to win a first order | Ignores later purchases |
| Contribution margin per order | What each sale really earns | Only as good as your cost data |
| Customer lifetime value | What a customer is worth over time | Easy to overestimate early |
Contribution margin is the most useful of the four and the least used. It’s the selling price minus every cost that moves with the sale: cost of goods, freight, payment fees, packaging, discounts and returns. Work it out by product or category, not just as an average. Owners are often surprised to find that a handful of lines carry most of the profit, while a long tail of extra SKUs adds stock, photography and handling for very little return.
Service businesses can do the same with job costing. Six to twelve months of jobs broken down by job type shows which work clears a healthy margin and which barely breaks even. That list becomes your marketing brief: promote more of the first, and reprice or stop promoting the second.
Set a Break-Even Acquisition Cost Before You Scale
Customer value sets how much you can afford to spend to win a customer. If customers rarely return, the break-even cost of winning one is roughly the contribution margin on their first order. If they reliably come back, as dental patients or buyers of consumables tend to, you can spend more upfront because the margin arrives over several purchases. Be conservative: lifetime value always looks better in a spreadsheet than in the bank.
A simple test is to look at the last new customer you won and ask whether they were profitable on gross profit after the cost of acquiring them. If not, how confident are you that they’ll buy again, and how soon?
This matters most when scaling. As spend increases, each extra customer usually costs more, because the platforms have to reach further beyond your most likely buyers. A plan to take daily spend from $1.5K to $15K is really a question about how far acquisition cost can rise before each new customer stops making money. Know that number before budgets go up, not after. Our guides to budget allocation and conversion tracking cover the practical setup, and Google Ads offers customer lifecycle goals that let you value new customers more highly than existing ones in bidding.
Decide Whether This Year Is for Growth or Profit
A common pattern in growing businesses is that every spare dollar goes into growth without anyone deciding that’s the strategy. More products, more channels, more locations. Growth is a perfectly good goal, but it needs to be chosen, because it changes how marketing should be run.
In a growth year, accepting an acquisition cost close to break-even on the first order can be the right call, provided repeat purchases are reliable. In a profit year, the target acquisition cost should sit well below first-order margin, and campaigns that win low-margin customers get cut even if their ROAS looks good. Running a profit plan with growth-year settings, or the reverse, is where owners get caught out.
Growth Is About Losing Less Than You Add
A principle shared by owners who have scaled well is that growth is always about losing less than you add. Every customer who doesn’t return has to be replaced before marketing adds a single dollar of growth, so a business with a leaky customer base can spend more on acquisition every year and still stand still.
That makes retention a marketing lever, not an afterthought. Rebooking reminders, post-purchase emails, replenishment prompts and genuinely useful follow-up all reduce how much new acquisition you need to grow. Cohort reports, which show how each month’s new customers behave over the following months, are the clearest way to see whether retention is improving.
When More Marketing Is the Wrong Lever
Sometimes the honest answer is that the business doesn’t need more leads. A business receiving more than 200 enquiries a month and still turning work away has a pricing opportunity, not a marketing problem. More enquiries would only add cost. Raising prices and focusing promotion on the job types that clear the best margin would lift profit with the same capacity.
The same logic applies to clinics with full books and retailers selling out of key lines. When demand outstrips what you can deliver, price is usually the strongest lever available. business.gov.au suggests you review your pricing strategy whenever costs or market conditions change, and our guide to raising prices without losing your best customers covers how to do it in measured steps.
Making Marketing Accountable to Profit
Revenue and ROAS are useful, but they’re not the scoreboard. Contribution margin by product, acquisition cost for genuinely new customers and a realistic view of customer value show whether marketing is building a more profitable business. Once those numbers are in place, channel decisions get easier, and a marketing strategy can be built around the customers and work that actually pay. If your Meta results have softened at the same time, our guide on why Meta ads performance declines is a useful companion, and retailers with stores can apply the same thinking by channel with our guide to growing online sales alongside physical stores.
To find out what your marketing is really earning, contact us or email hello@thedigitalmarketingconsultants.com.au.